📈 Prometheus metrics
LiteLLM Exposes a /metrics endpoint for Prometheus to Poll
Quick Start
If you're using the LiteLLM CLI with litellm --config proxy_config.yaml then you need to pip install prometheus_client==0.20.0. This is already pre-installed on the litellm Docker image
Add this to your proxy config.yaml
model_list:
 - model_name: gpt-3.5-turbo
    litellm_params:
      model: gpt-3.5-turbo
litellm_settings:
  callbacks: ["prometheus"]
Start the proxy
litellm --config config.yaml --debug
Test Request
curl --location 'http://0.0.0.0:4000/chat/completions' \
    --header 'Content-Type: application/json' \
    --data '{
    "model": "gpt-3.5-turbo",
    "messages": [
        {
        "role": "user",
        "content": "what llm are you"
        }
    ]
}'
View Metrics on /metrics, Visit http://localhost:4000/metrics
http://localhost:4000/metrics

# <proxy_base_url>/metrics
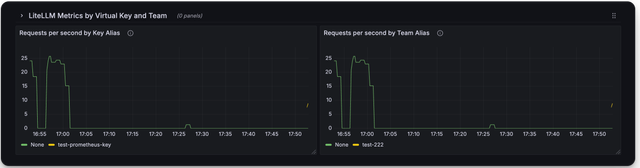
Virtual Keys, Teams, Internal Users
Use this for for tracking per user, key, team, etc.
| Metric Name | Description |
|---|---|
litellm_spend_metric | Total Spend, per "user", "key", "model", "team", "end-user" |
litellm_total_tokens | input + output tokens per "end_user", "hashed_api_key", "api_key_alias", "requested_model", "team", "team_alias", "user", "model" |
litellm_input_tokens | input tokens per "end_user", "hashed_api_key", "api_key_alias", "requested_model", "team", "team_alias", "user", "model" |
litellm_output_tokens | output tokens per "end_user", "hashed_api_key", "api_key_alias", "requested_model", "team", "team_alias", "user", "model" |
Team - Budget
| Metric Name | Description |
|---|---|
litellm_team_max_budget_metric | Max Budget for Team Labels: "team_id", "team_alias" |
litellm_remaining_team_budget_metric | Remaining Budget for Team (A team created on LiteLLM) Labels: "team_id", "team_alias" |
litellm_team_budget_remaining_hours_metric | Hours before the team budget is reset Labels: "team_id", "team_alias" |
Virtual Key - Budget
| Metric Name | Description |
|---|---|
litellm_api_key_max_budget_metric | Max Budget for API Key Labels: "hashed_api_key", "api_key_alias" |
litellm_remaining_api_key_budget_metric | Remaining Budget for API Key (A key Created on LiteLLM) Labels: "hashed_api_key", "api_key_alias" |
litellm_api_key_budget_remaining_hours_metric | Hours before the API Key budget is reset Labels: "hashed_api_key", "api_key_alias" |
Virtual Key - Rate Limit
| Metric Name | Description |
|---|---|
litellm_remaining_api_key_requests_for_model | Remaining Requests for a LiteLLM virtual API key, only if a model-specific rate limit (rpm) has been set for that virtual key. Labels: "hashed_api_key", "api_key_alias", "model" |
litellm_remaining_api_key_tokens_for_model | Remaining Tokens for a LiteLLM virtual API key, only if a model-specific token limit (tpm) has been set for that virtual key. Labels: "hashed_api_key", "api_key_alias", "model" |
Initialize Budget Metrics on Startup
If you want litellm to emit the budget metrics for all keys, teams irrespective of whether they are getting requests or not, set prometheus_initialize_budget_metrics to true in the config.yaml
How this works:
- If the
prometheus_initialize_budget_metricsis set totrue- Every 5 minutes litellm runs a cron job to read all keys, teams from the database
- It then emits the budget metrics for each key, team
- This is used to populate the budget metrics on the
/metricsendpoint
litellm_settings:
  callbacks: ["prometheus"]
  prometheus_initialize_budget_metrics: true
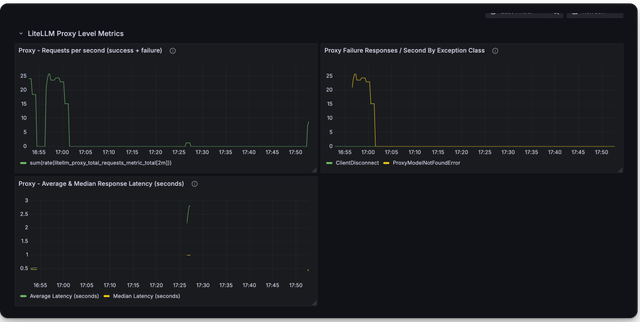
Proxy Level Tracking Metrics
Use this to track overall LiteLLM Proxy usage.
- Track Actual traffic rate to proxy
- Number of client side requests and failures for requests made to proxy
| Metric Name | Description |
|---|---|
litellm_proxy_failed_requests_metric | Total number of failed responses from proxy - the client did not get a success response from litellm proxy. Labels: "end_user", "hashed_api_key", "api_key_alias", "requested_model", "team", "team_alias", "user", "exception_status", "exception_class" |
litellm_proxy_total_requests_metric | Total number of requests made to the proxy server - track number of client side requests. Labels: "end_user", "hashed_api_key", "api_key_alias", "requested_model", "team", "team_alias", "user", "status_code" |
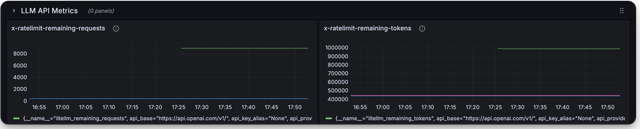
LLM Provider Metrics
Use this for LLM API Error monitoring and tracking remaining rate limits and token limits
Labels Tracked
| Label | Description |
|---|---|
| litellm_model_name | The name of the LLM model used by LiteLLM |
| requested_model | The model sent in the request |
| model_id | The model_id of the deployment. Autogenerated by LiteLLM, each deployment has a unique model_id |
| api_base | The API Base of the deployment |
| api_provider | The LLM API provider, used for the provider. Example (azure, openai, vertex_ai) |
| hashed_api_key | The hashed api key of the request |
| api_key_alias | The alias of the api key used |
| team | The team of the request |
| team_alias | The alias of the team used |
| exception_status | The status of the exception, if any |
| exception_class | The class of the exception, if any |
Success and Failure
| Metric Name | Description |
|---|---|
litellm_deployment_success_responses | Total number of successful LLM API calls for deployment. Labels: "requested_model", "litellm_model_name", "model_id", "api_base", "api_provider", "hashed_api_key", "api_key_alias", "team", "team_alias" |
litellm_deployment_failure_responses | Total number of failed LLM API calls for a specific LLM deployment. Labels: "requested_model", "litellm_model_name", "model_id", "api_base", "api_provider", "hashed_api_key", "api_key_alias", "team", "team_alias", "exception_status", "exception_class" |
litellm_deployment_total_requests | Total number of LLM API calls for deployment - success + failure. Labels: "requested_model", "litellm_model_name", "model_id", "api_base", "api_provider", "hashed_api_key", "api_key_alias", "team", "team_alias" |
Remaining Requests and Tokens
| Metric Name | Description |
|---|---|
litellm_remaining_requests_metric | Track x-ratelimit-remaining-requests returned from LLM API Deployment. Labels: "model_group", "api_provider", "api_base", "litellm_model_name", "hashed_api_key", "api_key_alias" |
litellm_remaining_tokens | Track x-ratelimit-remaining-tokens return from LLM API Deployment. Labels: "model_group", "api_provider", "api_base", "litellm_model_name", "hashed_api_key", "api_key_alias" |
Deployment State
| Metric Name | Description |
|---|---|
litellm_deployment_state | The state of the deployment: 0 = healthy, 1 = partial outage, 2 = complete outage. Labels: "litellm_model_name", "model_id", "api_base", "api_provider" |
litellm_deployment_latency_per_output_token | Latency per output token for deployment. Labels: "litellm_model_name", "model_id", "api_base", "api_provider", "hashed_api_key", "api_key_alias", "team", "team_alias" |
Fallback (Failover) Metrics
| Metric Name | Description |
|---|---|
litellm_deployment_cooled_down | Number of times a deployment has been cooled down by LiteLLM load balancing logic. Labels: "litellm_model_name", "model_id", "api_base", "api_provider", "exception_status" |
litellm_deployment_successful_fallbacks | Number of successful fallback requests from primary model -> fallback model. Labels: "requested_model", "fallback_model", "hashed_api_key", "api_key_alias", "team", "team_alias", "exception_status", "exception_class" |
litellm_deployment_failed_fallbacks | Number of failed fallback requests from primary model -> fallback model. Labels: "requested_model", "fallback_model", "hashed_api_key", "api_key_alias", "team", "team_alias", "exception_status", "exception_class" |
Request Latency Metrics
| Metric Name | Description |
|---|---|
litellm_request_total_latency_metric | Total latency (seconds) for a request to LiteLLM Proxy Server - tracked for labels "end_user", "hashed_api_key", "api_key_alias", "requested_model", "team", "team_alias", "user", "model" |
litellm_overhead_latency_metric | Latency overhead (seconds) added by LiteLLM processing - tracked for labels "end_user", "hashed_api_key", "api_key_alias", "requested_model", "team", "team_alias", "user", "model" |
litellm_llm_api_latency_metric | Latency (seconds) for just the LLM API call - tracked for labels "model", "hashed_api_key", "api_key_alias", "team", "team_alias", "requested_model", "end_user", "user" |
litellm_llm_api_time_to_first_token_metric | Time to first token for LLM API call - tracked for labels model, hashed_api_key, api_key_alias, team, team_alias [Note: only emitted for streaming requests] |
[BETA] Custom Metrics
Track custom metrics on prometheus on all events mentioned above.
- Define the custom metrics in the
config.yaml
model_list:
  - model_name: openai/gpt-3.5-turbo
    litellm_params:
      model: openai/gpt-3.5-turbo
      api_key: os.environ/OPENAI_API_KEY

litellm_settings:
  callbacks: ["prometheus"]
  custom_prometheus_metadata_labels: ["metadata.foo", "metadata.bar"]
- Make a request with the custom metadata labels
curl -L -X POST 'http://0.0.0.0:4000/v1/chat/completions' \
-H 'Content-Type: application/json' \
-H 'Authorization: Bearer <LITELLM_API_KEY>' \
-d '{
    "model": "openai/gpt-3.5-turbo",
    "messages": [
      {
        "role": "user",
        "content": [
          {
            "type": "text",
            "text": "What's in this image?"
          }
        ]
      }
    ],
    "max_tokens": 300,
    "metadata": {
        "foo": "hello world"
    }
}'
- Check your
/metricsendpoint for the custom metrics
... "metadata_foo": "hello world" ...
Monitor System Health
To monitor the health of litellm adjacent services (redis / postgres), do:
model_list:
 - model_name: gpt-3.5-turbo
    litellm_params:
      model: gpt-3.5-turbo
litellm_settings:
  service_callback: ["prometheus_system"]
| Metric Name | Description |
|---|---|
litellm_redis_latency | histogram latency for redis calls |
litellm_redis_fails | Number of failed redis calls |
litellm_self_latency | Histogram latency for successful litellm api call |
DB Transaction Queue Health Metrics
Use these metrics to monitor the health of the DB Transaction Queue. Eg. Monitoring the size of the in-memory and redis buffers.
| Metric Name | Description | Storage Type |
|---|---|---|
litellm_pod_lock_manager_size | Indicates which pod has the lock to write updates to the database. | Redis |
litellm_in_memory_daily_spend_update_queue_size | Number of items in the in-memory daily spend update queue. These are the aggregate spend logs for each user. | In-Memory |
litellm_redis_daily_spend_update_queue_size | Number of items in the Redis daily spend update queue. These are the aggregate spend logs for each user. | Redis |
litellm_in_memory_spend_update_queue_size | In-memory aggregate spend values for keys, users, teams, team members, etc. | In-Memory |
litellm_redis_spend_update_queue_size | Redis aggregate spend values for keys, users, teams, etc. | Redis |
🔥 LiteLLM Maintained Grafana Dashboards
Link to Grafana Dashboards maintained by LiteLLM
https://github.com/BerriAI/litellm/tree/main/cookbook/litellm_proxy_server/grafana_dashboard
Here is a screenshot of the metrics you can monitor with the LiteLLM Grafana Dashboard
Deprecated Metrics
| Metric Name | Description |
|---|---|
litellm_llm_api_failed_requests_metric | deprecated use litellm_proxy_failed_requests_metric |
litellm_requests_metric | deprecated use litellm_proxy_total_requests_metric |
Add authentication on /metrics endpoint
By default /metrics endpoint is unauthenticated.
You can opt into running litellm authentication on the /metrics endpoint by setting the following on the config
litellm_settings:
  require_auth_for_metrics_endpoint: true
FAQ
What are _created vs. _total metrics?
_createdmetrics are metrics that are created when the proxy starts_totalmetrics are metrics that are incremented for each request
You should consume the _total metrics for your counting purposes